Live Tool
EM Diagram Generator
Visualize your aircraft's complete performance envelope using Energy-Maneuverability theory—the same framework used to design and fly tactical aircraft.
Visualize your aircraft's complete performance envelope using Energy-Maneuverability theory—the same framework used to design and fly tactical aircraft.
Energy-Maneuverability (EM) theory was developed by fighter pilot and engineer John Boyd in the 1960s. It revolutionized how aircraft performance is understood and compared.
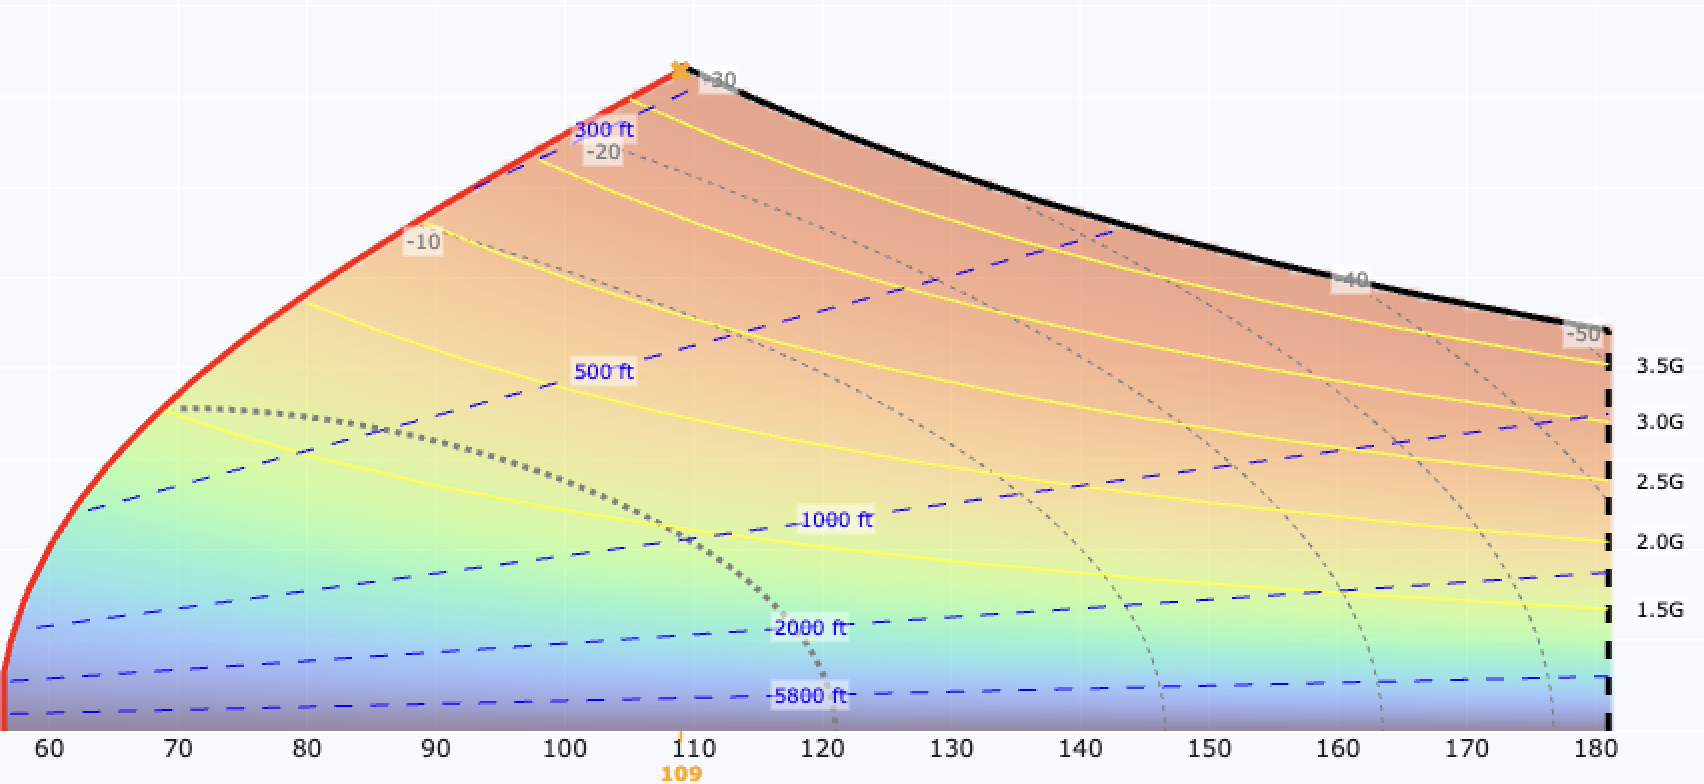
An EM diagram is a three-axis plot: airspeed vs. turn rate vs. load factor (G). Overlaid on this are Ps (specific excess power) contours, angle of bank shading, and turn radius lines. It shows every possible performance state your aircraft can achieve and where the boundaries are:
Fighter pilots use EM diagrams to understand tactical performance. Now you can see the same information for your Cessna, Cirrus, or Bonanza.
Everything you need to understand aircraft performance.
Cessna 172, Piper Cherokee, Cirrus SR22, Beechcraft Bonanza, and dozens more. Full aerodynamic parameters for each, not just POH approximations.
Enter your own aircraft data: wing area, weight, power, drag coefficients. See exactly how your specific aircraft performs.
Specific Excess Power shows where you're gaining or losing energy. See exactly where your aircraft can climb, accelerate, or is bleeding speed.
Vs, Va, Vne, Vno, Vy, Vx—all plotted on the diagram. See how they relate to the performance envelope, not just as isolated numbers.
TALLYAERO Exclusive. See how Vmc and Vyse actually change with weight, density altitude, bank angle, and configuration—not just the static POH number.
Generate publication-quality diagrams for briefings, training materials, or your own reference. Print them, share them, study them.
The red line in your POH is a lie—or at best, a half-truth. That published Vmc was tested under specific conditions: max gross weight, most rearward CG, sea level, critical engine windmilling, 5° bank into the good engine, takeoff power. Change any variable, and your actual Vmc changes too.
TALLYAERO calculates Dynamic Vmc in real-time. See how your minimum control speed shifts as you reduce weight, climb to altitude, or adjust configuration. This isn't a list of "factors that affect Vmc"—it's the actual calculated speed for your conditions.
The same applies to Vyse. Your best single-engine climb speed isn't fixed. Dynamic Vyse shows you the optimal speed for your actual weight and density altitude, not the sea-level-max-gross number in the book.
Multi-engine training teaches "factors that affect Vmc" as a memorization exercise:
But how much? Nobody tells you. TALLYAERO does. See the actual numbers, plotted on the EM diagram, so you understand your real safety margins—not abstract relationships.
Comprehensive aerodynamic data for the most popular GA aircraft.
Cessna 152, 172, 182 • Piper Cherokee, Warrior, Archer • Cirrus SR20, SR22 • Mooney M20 series
Piper Seminole, Seneca • Beechcraft Baron, Duchess • Cessna 310, 402 • Diamond DA42
Beechcraft Bonanza • Cirrus SR22T • Piper Malibu • Mooney Acclaim
Cessna 150, 152 • Piper Tomahawk • Diamond DA20, DA40 • Tecnam P2002
Don't see your aircraft? Use the custom editor to enter your own data.
Real physics, not approximations.
Standard atmosphere calculations for density altitude, pressure altitude, and true airspeed. See how performance changes with altitude and temperature.
Accurate CD0 and induced drag modeling. Not simplified "parasite + induced" approximations, but the actual aerodynamic relationship between lift and drag.
Power available accounts for altitude and airspeed effects. Propeller efficiency included for accurate thrust calculations across the flight envelope.
Turn rate, turn radius, and stall speed all vary with G-loading. The math is exact—the same equations used in flight test engineering.
Specific Excess Power (Ps) computed at every point in the envelope. Positive Ps means you can climb or accelerate. Negative means you're losing energy.
Switch between KIAS/KTAS, feet/meters, pounds/kilograms. The tool handles conversions correctly—you work in whatever units you prefer.
No account required. Select your aircraft and generate a diagram in seconds. Free to use, no strings attached.
Launch EM Diagram Tool