Live Tool
Maneuver Overlay Tool
Visualize FAA maneuvers as what they really are: time-integrated energy problems overlaid on real terrain.
Visualize FAA maneuvers as what they really are: time-integrated energy problems overlaid on real terrain.
Flight instructors explain steep turns with hand gestures. Students practice chandelles without understanding the energy they're managing. The math exists, but the visualization doesn't.
Every FAA maneuver is fundamentally an energy management exercise. You're trading altitude for airspeed, managing load factor, accounting for wind. But without seeing it, you're flying by feel alone.
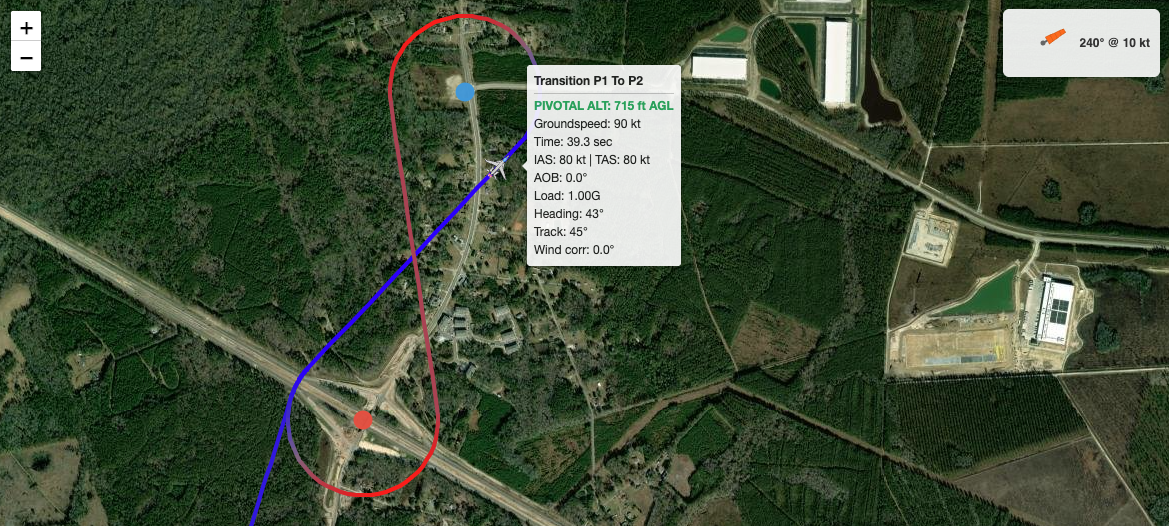
The Maneuver Overlay Tool shows exactly how altitude, airspeed, and energy interact throughout each maneuver—plotted on real terrain so you can see where you'll end up relative to the airport, obstacles, and the ground.
From private pilot to commercial, visualize the maneuvers that matter.
45° and 50° bank angles with full load factor visualization. See altitude loss, turn radius, and exactly where you'll complete the turn.
Glide management from abeam the numbers to touchdown. See how slip affects your glide path and where you'll land based on technique.
The critical GO/NO-GO decision. See exactly what altitude and conditions you need to make it back to the runway—with safety margins.
Where can you reach from any point? Plot glide paths on actual terrain and see your options when the engine quits.
The climbing 180° turn with constantly changing bank. See how energy trades between altitude and heading throughout the maneuver.
Undulating climbs and descents with reversing turns. The rhythm of energy management visualized as a continuous path.
Continuous descent in a spiral. Emergency descent technique shown with altitude loss rate and ground track.
Figure-eight around two ground references at pivotal altitude. See the geometry and energy together.
Ground reference maneuvers with wind correction. See how wind affects your ground track and required bank angles.
The same math as the EM Diagram. One source of truth.
The Maneuver Overlay uses the same physics calculations as the EM Diagram. Turn rate, turn radius, stall speed, energy bleed—all computed from first principles, not approximations.
Maneuvers are computed at the actual TAS for your selected altitude and conditions. The ground track reflects what you'll actually fly, not a simplified IAS assumption.
Higher G means higher stall speed and more drag. Energy bleed is modeled accurately throughout turns, not ignored.
Enter wind the aviation way: direction it's blowing FROM. The tool converts to ground track vectors internally. Your input matches what you'd get from ATIS or a weather brief.
Click anywhere on the map to get field elevation. Maneuvers terminate when they reach the ground. See exactly how much altitude you need to complete each maneuver.
Scrub through the maneuver second by second. See heading, bank angle, G-load, airspeed, and altitude at every point in time.
Three steps to visualize any maneuver.
Choose from 100+ presets or enter custom data. The tool uses your aircraft's actual performance parameters.
Click on the map to place your starting position. Search for airports or just click anywhere. Set altitude, heading, and wind.
Select the maneuver and parameters. The tool computes the entire flight path and displays it on the map in real time.
Brief maneuvers with actual visualizations instead of hand gestures. Show students exactly what they're about to fly, where they'll end up, and what the energy picture looks like.
Understand maneuvers before you fly them. See the geometry, the energy management, and the decision points. Don't just practice—understand.
No account required. Pick an airport, select a maneuver, and see the physics in action. Free to use.
Launch Maneuver Overlay